Market Outlook
May 25, 2017
Market Cues
Domestic Indices
Chg (%)
(Pts)
(Close)
Indian markets are likely to open on positive note tracking the SGX Nifty and Global
BSE Sensex
(0.2)
(64)
30,302
markets.
Nifty
(0.3)
(26)
9,361
The US equities closed higher on Wednesday as investors cheered the Federal
Mid Cap
(1.4)
(203)
14,038
Reserve's plan for scaling back its massive $4.5 trillion balance sheet. The Dow
Small Cap
(1.4)
(213)
14,557
Jones Industrial Average grinded higher for a fifth straight win, topping the 21,000
level. Specifically, most FOMC members felt the next rate hike should come soon,
Bankex
(0.1)
(34)
25,570
and agreed to begin unwinding the central bank's balance sheet. The S&P 500 Index
and Nasdaq Composite followed the Dow higher, with the SPX notching an all-time
Global Indices
Chg (%)
(Pts)
(Close)
closing high. Attention has now turned to tomorrow's OPEC meeting.
Dow Jones
0.4
175
21,012
The UK markets ended higher on Wednesday; outperforming the broader European
Nasdaq
0.4
24
6,163
markets as investors shook off disappointing corporate news and a credit
FTSE
0.4
30
7,515
downgrade for China. FTSE 100 ended 0.4% higher at 7,514.90, logging its highest
Nikkei
(00.7
130
19,743
close since May 16.
Hang Seng
0.1
225
25,429
The Indian markets swung into weakness for the second day in row as the Sensex
Shanghai Com
0.1
2
3,064
closed just above 30,300 and the Nifty gave up control of 9,400 ahead of the
derivatives expiry. BSE Sensex closed lower by 0.2 per cent, while the Nifty 50 fell
Advances / Declines
BSE
NSE
0.27%.
Advances
1,639
1,336
News Analysis
Declines
2,114
1,350
Lupin 4QFY17 result review
Unchanged
133
70
Cipla 4QFY17 result preview
Detailed analysis on Pg2
Volumes (` Cr)
#BSE
4,161
Investor’s Ready Reckoner
NSE
27,370
Key Domestic & Global Indicators
Stock Watch: Latest investment recommendations on 150+ stocks
#Net Inflows (` Cr)
Net
Mtd
Ytd
Refer Pg6 onwards
FII
(56895
( 9,590
51,602
Top Picks
MFs
8416
6,062
26,744
CMP
Target
Upside
Company
Sector
Rating
(`)
(`)
(%)
Blue Star
Capital Goods
Buy
636
760
19.6
Top Gainers
Price (`)
Chg (%)
Dewan Housing Fin. Financials
Buy
396
520
31.5
Voltasem
448
9.2
Mahindra Lifespace Real Estate
Buy
416
522
25.6
Jubilant
723
6.6
Navkar Corporation Others
Buy
204
265
29.9
Religare
194
6.6
KEI Industries
Capital Goods
Buy
201
239
18.7
More Top Picks on Pg4
Gruh
403
5.8
Tatamotors
469
4.3
Key Upcoming Events
Previous
Consensus
Date
Region
Event Description
Reading
Expectations
Top Losers
Price (`)
Chg (%)
May 25, 2017 US
Initial Jobless claims
232.00
238.00
Videoind
258
(10.0)
May 25, 2017 US
GDP Qoq (Annualised)
0.70
0.90
Jpassociat
9
(9.4)
May 26, 2017 UK
GDP (YoY)
2.10
2.10
Tataelxsi
1,327
(8.6)
May 30, 2017 Euro Zone Euro-Zone Consumer Confidence
(3.30)
--
May 30, 2017 China
PMI Manufacturing
51.20
51.00
Mfsl
568
(8.5)
May 31, 2017 US
Consumer Confidence
120.30
120.00
Ncc
83
(8.5)
More Events on Pg5
#as on May 24, 2017
Market Outlook
May 25, 2017
News Analysis
Lupin (CMP: `1,227 / TP: `1,809 / Upside: 47.4%)
The company for 4QFY2017, posted results, much below expectations mainly on
OPM and the net profit front. The revenues came in at `4,162cr V/s `4,338cr, a
yoy growth of 1.7%. The sales were impacted on back of the USA (`1901cr), a yoy
dip of 13.2%. Other significant markets India (`878.8cr) a yoy growth of 13.8%
yoy, APAC (`612cr), a yoy growth of 35%, EMEA (`301.2cr), a yoy growth of
22.8%, LATAM (`126.9cr), a yoy growth of 37.3%.
On the OPM front, the EBDITA margins came at 16.6% V/s 25.7% expected V/s
31.2% in 4QFY2016. While the Gross margins came in at 71.5% V/s 73.8%, a
yoy rise of 24.4%, 31.3% and 37.7% in the employee, R&D and other expenses
lead the contraction in the OPM, higher than expected. Net Impact of foreign
exchange fluctuation on EBITDA was a loss of `1,68cr during 4QFY2017 as
compared to a gain of `26.7cr during 4QFY2016 and a gain of `27.6cr during
3QFY2017. Also, the company made a provision for liability towards its Australian
subsidiary amounting to `155.9cr, in respect of compensation for patent litigation
towards its Isabelle generic launch in Australia. These aided the contraction in the
OPM.
Thus, the Adj. PAT during the quarter came in at `380.3cr V/s `710.6cr expected,
a yoy dip of 52.9%.Given the valuations, we maintain our buy rating on the stock.
Cipla (CMP: `520 / TP: `465 / Upside: (10.6%))
For 4QFY2017, the company is expected to post robust numbers, also aided by
the low base effect. For the quarter the sales is expected to come in at `3,817cr ,
registering a yoy growth of 19.0%, aided by robust growth in domestic and export
markets. On the OPM front the EBDITA Margins are expected to come in at 16.8%
V/s 5.0% in 4QFY2016. Thus the Adj. net profit is expected to come in at `299cr
V/s `81cr in 4QFY2016. We maintain our reduce on the stock.
Economic and Political News
Union Cabinet clears national procurement policy that gives preference to
locally made goods and services,
Moody's downgrades China's rating in 30 years
The Government scraps foreign investment board in push for more FDI
Moody’s downgrades Hong Kong after China ratings cut
Corporate News
Prabhat Dairy eyes 50% business from B2C products by 2020
Higher expenses pare Amara Raja Batteries' Q4 net by 9% to `99cr
Adani Enterprises posts Rs 31 cr standalone Q4 loss in FY17
Dish TV post `28cr Q4 loss, subscription revenue falls 11%
Market Outlook
May 25, 2017
Quarterly Bloomberg Brokers Consensus Estimate
Ashok Leyland Ltd - May 25, 2017
Particulars ( ` cr)
4QFY17E
4QFY16
y-o-y (%)
3QFY17
q-o-q (%)
Net sales
6,469
5,893
9.8
4,335
49.2
EBITDA
728
753
(3.3)
454
60.2
EBITDA margin (%)
11.3
12.8
10.5
Net profit
425
77
451.7
186
128.6
Indian Oil Corp Ltd - May 25, 2017
Particulars ( ` cr)
4QFY17E
4QFY16
y-o-y (%)
3QFY17
q-o-q (%)
Net sales
98,763
80,019
23.4
92,633
6.6
EBITDA
7,329
4,044
81.2
7,949
(7.8)
EBITDA margin (%)
7.4
5.1
8.6
Net profit
3,797
1,243
205.4
3,995
(5.0)
Britannia Consol - May 25, 2017
Particulars ( ` cr)
4QFY17E
4QFY16
y-o-y (%)
3QFY17
q-o-q (%)
Net sales
2,361
2,190
7.8
2,265
4.2
EBITDA
312
291
7.3
313
(0.0)
EBITDA margin (%)
13.2
13.3
13.8
Net profit
215
190
13.2
220
(2.3)
Bosch Ltd - May 25, 2017
Particulars ( ` cr)
1QCY17E
1QCY16
y-o-y (%)
4QCY16
q-o-q (%)
Net sales
2,875
2,280
26.1
2,635
9.1
EBITDA
584
483
20.9
583
0.1
EBITDA margin (%)
20.3
21.2
22.1
Net profit
397
344
15.6
376
5.7
Cipla - May 25, 2017
Particulars ( ` cr)
4QFY17E
4QFY16
y-o-y (%)
3QFY17
q-o-q (%)
Net sales
3769
2683
40.3
2588
45.6
EBITDA
688
105
555.2
532
29.3
EBITDA margin (%)
18.3
3.9
20.6
Net profit
338
35
865.7
341
(1)
NMDC - May 25, 2017
Particulars ( ` cr)
4QFY17E
4QFY16
y-o-y (%)
3QFY17
q-o-q (%)
Net sales
2,685
1,530
75.5
2,498
7.5
EBITDA
1,436
540
166.0
1,027
39.9
EBITDA margin (%)
53.5
35.3
41.1
Net profit
1,052
720
46.1
726
44.9
Market Outlook
May 25, 2017
Top Picks ★★★★★
Market Cap
CMP
Target
Upside
Company
Rationale
(` Cr)
(`)
(`)
(%)
Strong growth in domestic business due to its leadership
in acute therapeutic segment. Alkem expects to launch
Alkem Laboratories
21,870
1,829
2,257
23.4
more products in USA, which bodes for its international
business.
We expect the company would report strong profitability
Asian Granito
1,020
339
405
19.5
owing to better product mix, higher B2C sales and
amalgamation synergy..
Favourable outlook for the AC industry to augur well for
Cooling products business which is out pacing the market
Blue Star
6,077
636
760
19.6
growth. EMPPAC division's profitability to improve once
operating environment turns around..
With a focus on the low and medium income (LMI)
consumer segment, the company has increased its
Dewan Housing Finance
12,395
396
520
31.5
presence in tier-II & III cities where the growth opportunity
is immense.
Strong loan growth backed by diversified loan portfolio
and adequate CAR. ROE & ROA likely to remain decent
Equitas Holdings
4,958
147
235
60.2
as risk of dilution remains low. Attractive valuations
considering growth.
Economic recovery to have favourable impact on
advertising & circulation revenue growth. Further, the
Jagran Prakashan
5,783
177
225
27.2
acquisition of a radio business (Radio City) would also
boost the company's revenue growth.
High order book execution in EPC segment, rising B2C
KEI Industries
1,563
201
239
18.7
sales and higher exports to boost the revenues and
profitability
Speedier execution and speedier sales, strong revenue
Mahindra Lifespace
2,133
416
522
25.6
visibilty in short-to-long run, attractive valuations
Massive capacity expansion along with rail advantage at
Navkar Corporation
2,909
204
265
29.9
ICD as well CFS augurs well for the company
Strong brands and distribution network would boost
Siyaram Silk Mills
1,664
1,775
1,872
5.4
growth going ahead. Stock currently trades at an
inexpensive valuation.
Market leadership in Hindi news genre and no.
2
viewership ranking in English news genre, exit from the
TV Today Network
1,506
253
344
36.2
radio business, and anticipated growth in ad spends by
corporates to benefit the stock.
Source: Company, Angel Research
Market Outlook
May 25, 2017
Key Upcoming Events
Result Calendar
Date
Company
May 25, 2017
Bosch India, Ashok Leyland, Britannia, Mphasis, NMDC, IOC, GSPL, Page Industries, Heritage Foods, Cipla
Tata Chemicals, Crompton Greaves, Areva, ITC, Tech Mahindra, Styrolution, Sun Pharma, Divi's Lab., Indoco
May 26, 2017
Remedies
May 27, 2017
India Cements, Siyaram Silk Mills, Adani Power, PTC India
May 28, 2017
Ipca labs
May 29, 2017
BHEL, Coal India, Bajaj Electrical, Aurobindo Pharma, NTPC
May 30, 2017
M&M, BGR Energy , Rural Elec.Corp., SAIL, Hindalco, Finolex Cables, Anant Raj
Source: Bloomberg, Angel Research
Global economic events release calendar
Date
Time
Country
Event Description
Unit
Period
Bloomberg Data
Last Reported Estimated
May 25, 2017 6:00PM US
Initial Jobless claims
Thousands
May 20
232.00
238.00
6:00PM US
GDP Qoq (Annualised)
% Change
1Q S
0.70
0.90
May 26, 2017 2:00PM UK
GDP (YoY)
% Change
1Q P
2.10
2.10
May 30, 2017 2:30PM Euro Zone
Euro-Zone Consumer Confidence
Value
May F
(3.30)
--
6:30AM China
PMI Manufacturing
Value
May
51.20
51.00
May 31, 2017 7:30PM US
Consumer Confidence
S.A./ 1985=100
May
120.30
120.00
1:25PM Germany
Unemployment change (000's)
Thousands
May
(15.00)
--
Jun 1, 2017
1:25PM Germany
PMI Manufacturing
Value
May F
59.40
--
2:00PM UK
PMI Manufacturing
Value
May
57.30
--
Jun 2, 2017
6:00PM US
Change in Nonfarm payrolls
Thousands
May
211.00
175.00
6:00PM US
Unnemployment rate
%
May
4.40
4.40
Jun 6, 2017
1:25PM Germany
PMI Services
Value
May F
55.20
--
Jun 7, 2017
2:30PM Euro Zone
Euro-Zone GDP s.a. (QoQ)
% Change
1Q F
0.50
--
2:30PM India
RBI Reverse Repo rate
%
Jun 7
6.00
--
2:30PM India
RBI Repo rate
%
Jun 7
6.25
--
2:30PM India
RBI Cash Reserve ratio
%
Jun 7
4.00
--
Jun 8, 2017
5:15PM Euro Zone
ECB announces interest rates
%
Jun 8
--
--
China
Exports YoY%
% Change
May
8.00
--
Jun 9, 2017
India
Imports YoY%
% Change
May
49.10
--
India
Exports YoY%
% Change
May
19.80
--
2:00PM UK
Industrial Production (YoY)
% Change
Apr
1.40
--
7:00AM China
Consumer Price Index (YoY)
% Change
May
1.20
--
Jun 12, 2017
5:30PM India
Industrial Production YoY
% Change
Apr
2.70
--
Source: Bloomberg, Angel Research
Market Outlook
May 25, 2017
Macro watch
Exhibit 1: Quarterly GDP trends
Exhibit 2: IIP trends
(%)
(%)
8.6
9.0
8.3
8.4
10.0
8.9
7.7
7.8
9.0
8.0
8.0
7.4
7.2
8.0
6.9
7.0
6.8
7.0
7.0
5.7
5.7
6.0
6.0
5.2
4.9
4.9
6.0
5.6
5.0
3.8
4.0
5.0
2.6
2.7
3.0
1.9
4.0
2.0
1.0
3.0
-
Source: CSO, Angel Research
Source: MOSPI, Angel Research
Exhibit 3: Monthly CPI inflation trends
Exhibit 4: Manufacturing and services PMI
56.0
Mfg. PMI
Services PMI
(%)
7.0
54.0
6.1
5.8
5.8
6.0
5.1
52.0
5.0
4.3
4.2
3.9
50.0
3.6
3.7
4.0
3.4
3.2
3.0
48.0
3.0
46.0
2.0
1.0
44.0
-
42.0
Source: MOSPI, Angel Research
Source: Market, Angel Research; Note: Level above 50 indicates expansion
Exhibit 5: Exports and imports growth trends
Exhibit 6: Key policy rates
(%)
Exports yoy growth
Imports yoy growth
(%)
Repo rate
Reverse Repo rate
CRR
60.0
7.00
50.0
6.50
40.0
6.00
30.0
5.50
20.0
5.00
10.0
4.50
0.0
4.00
(10.0)
(20.0)
3.50
(30.0)
3.00
Source: Bloomberg, Angel Research
Source: RBI, Angel Research
Market Outlook
May 25, 2017
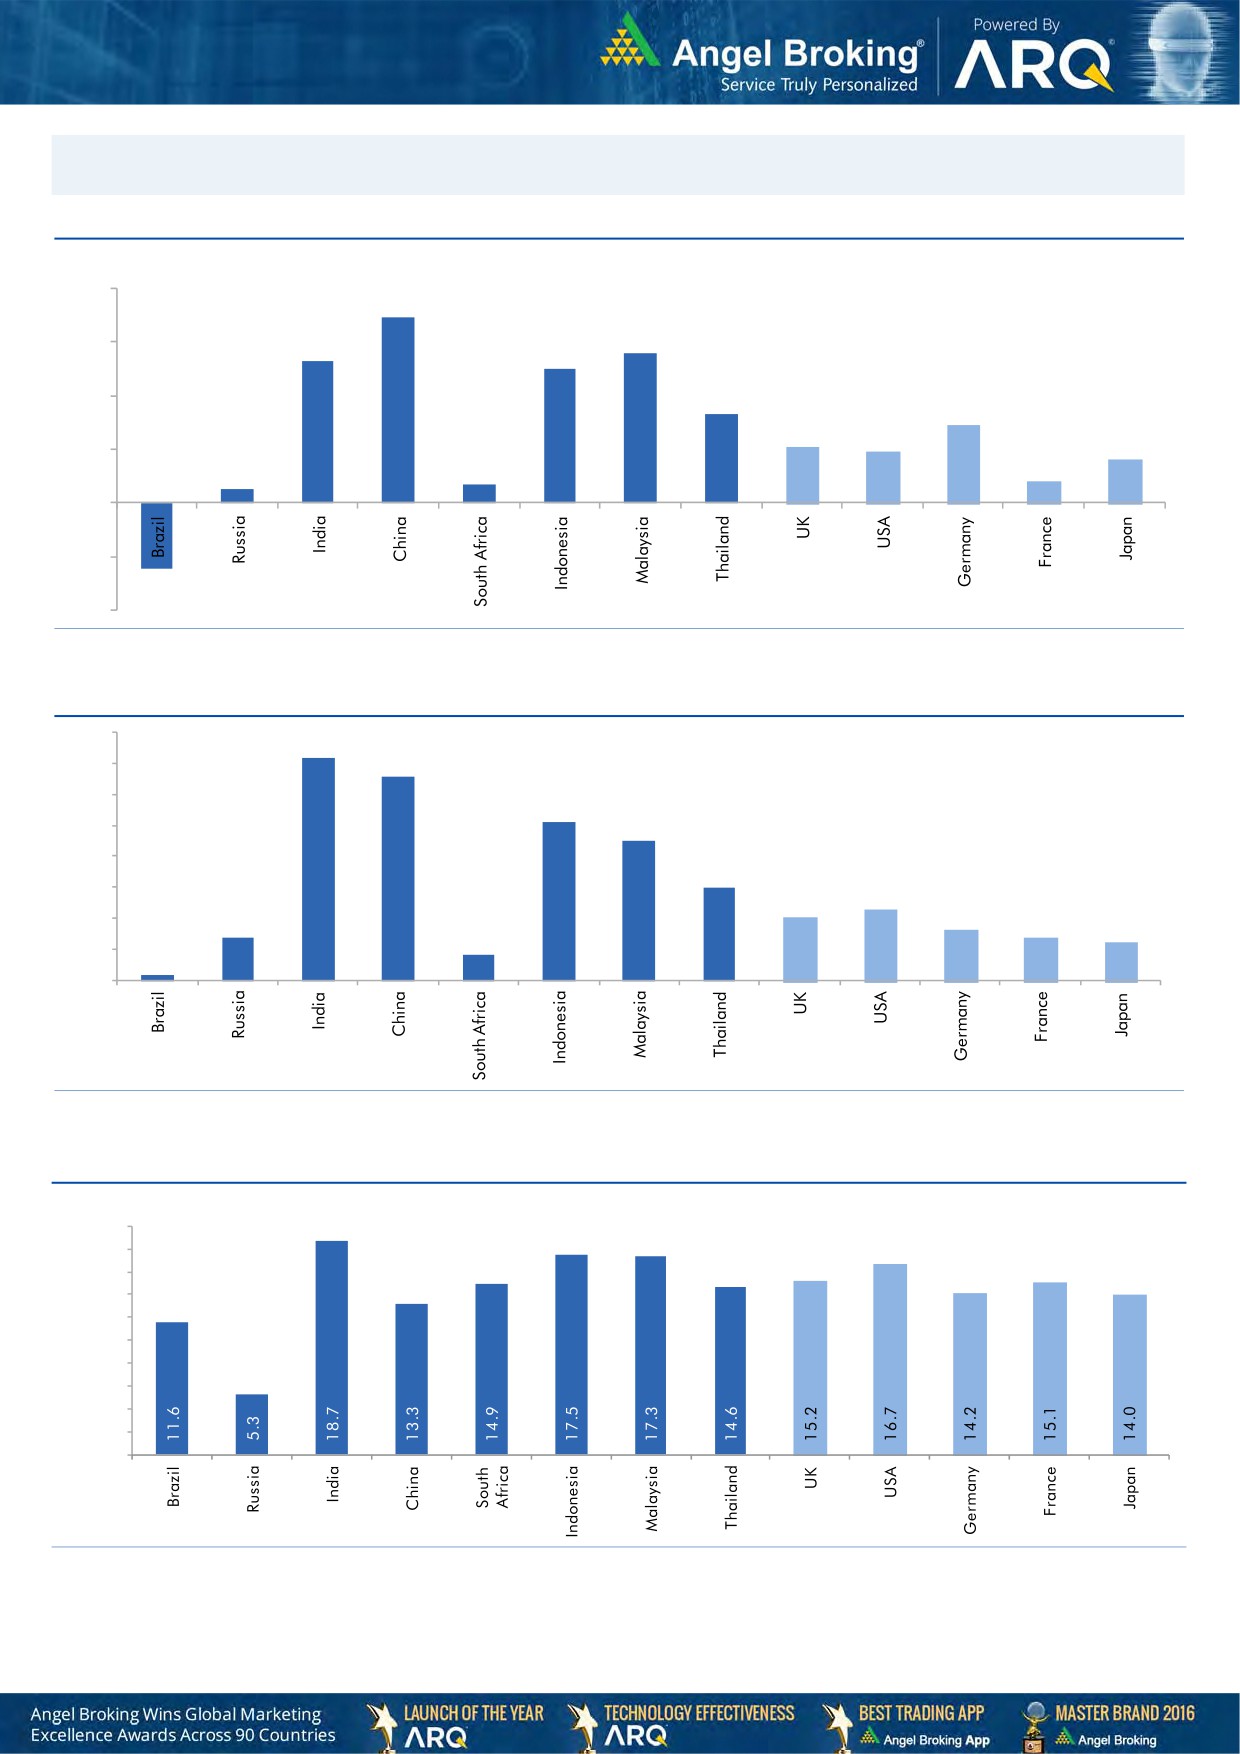
Global watch
Exhibit 1: Latest quarterly GDP Growth (%, yoy) across select developing and developed countries
(%)
8.0
6.9
5.6
6.0
5.3
5.0
0.7
4.0
3.3
2.9
2.1
1.9
0.5
2.0
1.6
0.8
-
(2.0)
(2.5)
(4.0)
Source: Bloomberg, Angel Research
Exhibit 2: 2016 GDP Growth projection by IMF (%, yoy) across select developing and developed countries
(%)
7.2
7.0
6.6
6.0
5.1
5.0
4.5
4.0
3.0
3.0
2.3
2.0
1.4
1.6
2.0
1.4
1.2
0.2
0.8
1.0
-
Source: IMF, Angel Research
Exhibit 3: One year forward P-E ratio across select developing and developed countries
(x)
20.0
18.0
16.0
14.0
12.0
10.0
8.0
6.0
4.0
2.0
-
Source: IMF, Angel Research, #Data as of 24/5/2017
Market Outlook
May 25, 2017
Exhibit 4: Relative performance of indices across globe
Returns (%)
Country
Name of index
Closing price
1M
3M
1YR
Brazil
Bovespa
62,639
(2.6)
(6.5)
23.2
Russia
Micex
1,962
2.4
(9.2)
5.0
India
Nifty
9,428
3.5
7.1
19.9
China
Shanghai Composite
3,091
(3.3)
(3.8)
9.1
South Africa
Top 40
47,963
2.8
4.4
3.4
Mexico
Mexbol
49,067
0.6
3.5
8.7
Indonesia
LQ45
970
3.9
8.5
18.4
Malaysia
KLCI
1,768
2.0
3.6
7.2
Thailand
SET 50
982
(1.8)
(1.0)
12.3
USA
Dow Jones
20,805
2.0
0.9
18.9
UK
FTSE
7,471
4.5
2.3
21.7
Japan
Nikkei
19,591
6.8
1.8
17.7
Germany
DAX
12,639
5.3
7.2
23.0
France
CAC
5,324
6.7
8.1
17.9
Source: Bloomberg, Angel Research, #Data as of 24/5/2017
Stock Watch
May 25, 2017
Company Name
Reco
CMP
Target
Mkt Cap
Sales ( Čcr )
OPM(%)
EPS (Č)
PER(x)
P/BV(x)
RoE(%)
EV/Sales(x)
(Č)
Price ( Č)
( Č cr )
FY17E
FY18E
FY17E
FY18E
FY17E
FY18E
FY17E
FY18E
FY17E
FY18E
FY17E
FY18E
FY17E
FY18E
Agri / Agri Chemical
Rallis
Neutral
237
-
4,609
1,937
2,164
13.3
14.3
9.0
11.0
26.3
21.6
4.6
4.0
18.4
19.8
2.4
2.1
United Phosphorus
Neutral
785
-
39,876
15,176
17,604
18.5
18.5
37.4
44.6
21.0
17.6
4.1
3.4
21.4
21.2
2.7
2.3
Auto & Auto Ancillary
Amara Raja Batteries
Buy
835
1,009
14,260
5,305
6,100
16.0
16.3
28.4
34.0
29.4
24.6
5.7
4.7
19.3
19.3
2.7
2.3
Apollo Tyres
Accumulate
221
235
11,272
12,877
14,504
14.3
13.9
21.4
23.0
10.3
9.6
1.6
1.4
16.4
15.2
1.0
1.0
Ashok Leyland
Buy
82
111
23,422
20,021
21,915
11.6
11.9
4.5
5.3
18.3
15.5
3.7
3.3
20.6
21.5
1.1
1.0
Bajaj Auto
Neutral
2,772
-
80,200
25,093
27,891
19.5
19.2
143.9
162.5
19.3
17.1
5.4
4.6
30.3
29.4
2.9
2.6
Bharat Forge
Neutral
1,085
-
25,249
7,726
8,713
20.5
21.2
35.3
42.7
30.7
25.4
5.7
5.1
18.9
20.1
3.3
2.9
Ceat
Neutral
1,698
-
6,870
7,524
8,624
13.0
12.7
131.1
144.3
13.0
11.8
2.4
2.0
19.8
18.6
1.0
0.9
Eicher Motors
Neutral
27,365
-
74,460
16,583
20,447
17.5
18.0
598.0
745.2
45.8
36.7
15.6
11.9
41.2
38.3
4.3
3.4
Exide Industries
Neutral
222
-
18,891
7,439
8,307
15.0
15.0
8.1
9.3
27.4
23.9
3.8
3.4
14.3
16.7
2.2
1.9
Gabriel India
Accumulate
124
130
1,777
1,544
1,715
9.0
9.3
5.4
6.3
22.9
19.6
4.3
3.8
18.9
19.5
1.1
1.0
Hero Motocorp
Neutral
3,563
-
71,148
28,083
30,096
15.3
15.7
171.8
187.0
20.7
19.1
7.2
6.1
30.1
27.9
2.4
2.2
Indag Rubber
Neutral
202
-
529
286
326
19.8
16.8
11.7
13.3
17.3
15.1
2.9
2.7
17.8
17.1
1.5
1.3
Jamna Auto Industries
Neutral
223
-
1,774
1,486
1,620
9.8
9.9
15.0
17.2
14.8
12.9
3.3
2.8
21.8
21.3
1.3
1.1
JK Tyres
Neutral
162
-
3,680
7,455
8,056
15.0
15.0
21.8
24.5
7.4
6.6
1.6
1.3
22.8
21.3
0.6
0.5
L G Balakrishnan & Bros Neutral
702
-
1,102
1,302
1,432
11.6
11.9
43.7
53.0
16.1
13.3
2.3
2.1
13.8
14.2
0.9
0.9
Mahindra and Mahindra Neutral
1,308
-
81,208
46,534
53,077
11.6
11.7
67.3
78.1
19.4
16.8
3.2
2.8
15.4
15.8
1.7
1.5
Maruti
Neutral
6,856
-
207,096
67,822
83,288
16.0
16.4
253.8
312.4
27.0
22.0
6.2
5.0
23.0
22.9
2.7
2.1
Minda Industries
Neutral
557
-
4,812
2,728
3,042
9.0
9.1
68.2
86.2
8.2
6.5
1.9
1.5
23.8
24.3
1.8
1.6
Motherson Sumi
Neutral
420
-
58,943
45,896
53,687
7.8
8.3
13.0
16.1
32.2
26.1
10.4
8.3
34.7
35.4
1.4
1.1
Rane Brake Lining
Neutral
1,067
-
845
511
562
11.3
11.5
28.1
30.9
38.0
34.5
5.8
5.3
15.3
15.0
1.8
1.6
Setco Automotive
Neutral
38
-
502
741
837
13.0
13.0
15.2
17.0
2.5
2.2
0.4
0.4
15.8
16.3
1.1
1.0
Subros
Neutral
230
-
1,378
1,488
1,681
11.7
11.9
6.4
7.2
35.9
32.0
3.8
3.4
10.8
11.4
1.2
1.0
Swaraj Engines
Neutral
1,776
-
2,206
660
810
15.2
16.4
54.5
72.8
32.6
24.4
10.2
9.2
31.5
39.2
3.2
2.6
Tata Motors
Neutral
469
-
135,547
300,209
338,549
8.9
8.4
42.7
54.3
11.0
8.7
1.8
1.5
15.6
17.2
0.6
0.5
TVS Motor
Neutral
524
-
24,876
13,390
15,948
6.9
7.1
12.8
16.5
41.0
31.7
10.2
8.1
26.3
27.2
1.9
1.6
Capital Goods
ACE
Neutral
60
-
593
709
814
4.1
4.6
1.4
2.1
42.8
28.5
1.8
1.7
4.4
6.0
1.0
0.9
BEML
Neutral
1,135
-
4,727
3,451
4,055
6.3
9.2
31.4
57.9
36.2
19.6
2.2
2.0
6.3
10.9
1.5
1.3
BGR Energy
Neutral
151
-
1,088
16,567
33,848
6.0
5.6
7.8
5.9
19.3
25.6
1.1
1.1
4.7
4.2
0.2
0.1
Stock Watch
May 25, 2017
Company Name
Reco
CMP
Target
Mkt Cap
Sales ( Čcr )
OPM(%)
EPS (Č)
PER(x)
P/BV(x)
RoE(%)
EV/Sales(x)
(Č)
Price ( Č)
( Č cr )
FY17E
FY18E
FY17E
FY18E
FY17E
FY18E
FY17E
FY18E
FY17E
FY18E
FY17E
FY18E
FY17E
FY18E
Capital Goods
Bharat Electronics
Neutral
167
-
37,257
8,137
9,169
16.8
17.2
58.7
62.5
2.8
2.7
0.4
0.4
44.6
46.3
3.6
3.2
BHEL
Neutral
150
-
36,726
28,797
34,742
-
2.8
2.3
6.9
65.2
21.8
1.1
1.1
1.3
4.8
0.9
0.7
Blue Star
Buy
636
760
6,077
4,283
5,077
5.9
7.3
14.9
22.1
42.7
28.7
8.3
7.0
20.4
26.4
1.5
1.2
CG Power and Industrial
Neutral
88
-
5,525
5,777
6,120
5.9
7.0
3.3
4.5
26.7
19.6
1.2
1.1
4.4
5.9
0.9
0.8
Solutions
Greaves Cotton
Neutral
149
-
3,642
1,755
1,881
16.8
16.9
7.8
8.5
19.1
17.6
3.8
3.6
20.6
20.9
1.8
1.6
Inox Wind
Neutral
133
-
2,956
5,605
6,267
15.7
16.4
24.8
30.0
5.4
4.4
1.5
1.1
25.9
24.4
0.6
0.5
KEC International
Neutral
244
-
6,279
9,294
10,186
7.9
8.1
9.9
11.9
24.7
20.5
3.6
3.1
15.6
16.3
0.9
0.8
KEI Industries
Buy
201
239
1,563
2,682
3,058
10.4
10.0
11.7
12.8
17.1
15.7
3.4
2.9
20.1
18.2
0.8
0.7
Thermax
Neutral
983
-
11,718
5,421
5,940
7.3
7.3
25.7
30.2
38.3
32.6
4.6
4.2
12.2
13.1
2.0
1.9
VATech Wabag
Neutral
675
-
3,684
3,136
3,845
8.9
9.1
26.0
35.9
26.0
18.8
3.3
2.8
13.4
15.9
1.1
0.9
Voltas
Neutral
448
-
14,809
6,511
7,514
7.9
8.7
12.9
16.3
34.7
27.5
6.2
5.5
16.7
18.5
2.0
1.7
Cement
ACC
Neutral
1,586
-
29,784
11,225
13,172
13.2
16.9
44.5
75.5
35.6
21.0
3.4
3.1
11.2
14.2
2.7
2.3
Ambuja Cements
Neutral
236
-
46,772
9,350
10,979
18.2
22.5
5.8
9.5
40.6
24.8
3.4
3.1
10.2
12.5
5.0
4.3
India Cements
Neutral
185
-
5,667
4,364
4,997
18.5
19.2
7.9
11.3
23.4
16.3
1.7
1.6
8.0
8.5
2.1
1.8
J K Lakshmi Cement
Neutral
481
-
5,662
2,913
3,412
14.5
19.5
7.5
22.5
64.2
21.4
3.9
3.3
12.5
18.0
2.5
2.1
JK Cement
Neutral
1,095
-
7,654
4,398
5,173
15.5
17.5
31.2
55.5
35.1
19.7
4.2
3.7
12.0
15.5
2.3
1.9
Orient Cement
Neutral
146
-
2,982
2,114
2,558
18.5
20.5
8.1
11.3
18.0
12.9
2.7
2.2
9.0
14.0
2.0
1.6
UltraTech Cement
Neutral
4,175
-
114,595
25,768
30,385
21.0
23.5
111.0
160.0
37.6
26.1
4.8
4.2
13.5
15.8
4.5
3.8
Construction
Engineers India
Neutral
154
-
10,374
1,725
1,935
16.0
19.1
11.4
13.9
13.5
11.1
1.9
1.8
13.4
15.3
4.9
4.4
Gujarat Pipavav Port
Neutral
147
-
7,082
705
788
52.2
51.7
5.0
5.6
29.3
26.2
2.9
2.6
11.2
11.2
9.7
8.2
ITNL
Neutral
100
-
3,290
8,946
10,017
31.0
31.6
8.1
9.1
12.4
11.0
0.5
0.5
4.2
5.0
3.7
3.4
KNR Constructions
Neutral
199
-
2,791
1,385
1,673
14.7
14.0
41.2
48.5
4.8
4.1
0.9
0.8
14.9
15.2
2.1
1.7
Larsen & Toubro
Neutral
1,685
-
157,252
111,017
124,908
11.0
11.0
61.1
66.7
27.6
25.3
3.3
3.1
13.1
12.9
2.5
2.3
MEP Infra
Neutral
64
-
1,045
1,877
1,943
30.6
29.8
3.0
4.2
21.4
15.3
10.4
7.0
0.6
0.6
1.9
1.8
Nagarjuna Const.
Neutral
83
-
4,628
8,842
9,775
9.1
8.8
5.3
6.4
15.7
13.0
1.2
1.1
8.2
9.1
0.7
0.6
NBCC
Neutral
181
-
16,254
7,428
9,549
7.9
8.6
8.2
11.0
22.0
16.4
1.1
0.9
28.2
28.7
1.9
1.4
PNC Infratech
Neutral
141
-
3,625
2,350
2,904
13.1
13.2
9.0
8.8
15.7
16.1
0.6
0.5
15.9
13.9
1.7
1.3
Power Mech Projects
Neutral
580
-
853
1,801
2,219
12.7
14.6
72.1
113.9
8.0
5.1
1.5
1.3
16.8
11.9
0.5
0.4
Sadbhav Engineering
Neutral
306
-
5,256
3,598
4,140
10.3
10.6
9.0
11.9
34.0
25.7
3.6
3.1
9.9
11.9
1.7
1.5
Stock Watch
May 25, 2017
Company Name
Reco
CMP
Target
Mkt Cap
Sales ( Čcr )
OPM(%)
EPS (Č)
PER(x)
P/BV(x)
RoE(%)
EV/Sales(x)
(Č)
Price ( Č)
( Č cr )
FY17E
FY18E
FY17E
FY18E
FY17E
FY18E
FY17E
FY18E
FY17E
FY18E
FY17E
FY18E
FY17E
FY18E
Construction
Simplex Infra
Neutral
395
-
1,954
6,829
7,954
10.5
10.5
31.4
37.4
12.6
10.6
1.3
1.2
9.9
13.4
0.7
0.6
SIPL
Neutral
102
-
3,579
1,036
1,252
65.5
66.2
(8.4)
(5.6)
3.8
4.3
(22.8)
(15.9)
11.7
9.7
Financials
Axis Bank
Buy
499
580
119,637
46,932
53,575
3.5
3.4
32.4
44.6
15.4
11.2
2.0
1.7
13.6
16.5
-
-
Bank of Baroda
Neutral
176
-
40,484
19,980
23,178
1.8
1.8
11.5
17.3
15.3
10.2
1.8
1.4
8.3
10.1
-
-
Can Fin Homes
Neutral
2,574
-
6,851
420
526
3.5
3.5
86.5
107.8
29.8
23.9
6.4
5.2
23.6
24.1
-
-
Canara Bank
Neutral
352
-
21,051
15,225
16,836
1.8
1.8
14.5
28.0
24.3
12.6
1.7
1.4
5.8
8.5
-
-
Cholamandalam Inv. &
Buy
1,004
1,230
15,691
2,012
2,317
6.3
6.3
42.7
53.6
23.5
18.7
3.7
3.2
16.9
18.3
-
-
Fin. Co.
Dewan Housing Finance Buy
396
520
12,395
2,225
2,688
2.9
2.9
29.7
34.6
13.3
11.4
2.2
1.4
16.1
14.8
-
-
Equitas Holdings
Buy
147
235
4,958
939
1,281
11.7
11.5
5.8
8.2
25.3
17.9
2.2
1.9
10.9
11.5
-
-
Federal Bank
Buy
107
125
18,501
8,259
8,995
3.0
3.0
4.3
5.6
25.0
19.2
2.1
2.0
8.5
10.1
-
-
HDFC
Neutral
1,525
-
242,287
11,475
13,450
3.4
3.4
45.3
52.5
33.7
29.1
6.5
5.7
20.2
20.5
-
-
HDFC Bank
Accumulate
1,569
1,650
402,537
46,097
55,433
4.5
4.5
58.4
68.0
26.9
23.1
4.7
3.9
18.8
18.6
-
-
ICICI Bank
Neutral
307
-
178,756
42,800
44,686
3.1
3.3
18.0
21.9
17.0
14.0
2.3
2.1
11.1
12.3
-
-
Karur Vysya Bank
Buy
118
140
7,155
5,640
6,030
3.3
3.2
8.9
10.0
13.3
11.8
1.4
1.3
11.2
11.4
-
-
Lakshmi Vilas Bank
Neutral
181
-
3,479
3,339
3,799
2.7
2.8
11.0
14.0
16.5
13.0
1.7
1.6
11.2
12.7
-
-
LIC Housing Finance
Neutral
672
-
33,888
3,712
4,293
2.6
2.5
39.0
46.0
17.2
14.6
3.2
2.8
19.9
20.1
-
-
Punjab Natl.Bank
Neutral
148
-
31,388
23,532
23,595
2.3
2.4
6.8
12.6
21.7
11.7
3.4
2.4
3.3
6.5
-
-
RBL Bank
Neutral
524
-
19,707
1,783
2,309
2.6
2.6
12.7
16.4
41.3
32.0
4.5
4.0
12.8
13.3
-
-
Repco Home Finance
Accumulate
746
825
4,665
388
457
4.5
4.2
30.0
38.0
24.9
19.6
4.1
3.5
18.0
19.2
-
-
South Ind.Bank
Neutral
25
-
4,554
6,435
7,578
2.5
2.5
2.7
3.1
9.4
8.2
1.2
1.0
10.1
11.2
-
-
St Bk of India
Neutral
283
-
229,631
88,650
98,335
2.6
2.6
13.5
18.8
21.0
15.1
2.0
1.8
7.0
8.5
-
-
Union Bank
Neutral
161
-
11,040
13,450
14,925
2.3
2.3
25.5
34.5
6.3
4.7
0.9
0.8
7.5
10.2
-
-
Yes Bank
Neutral
1,424
-
65,078
8,978
11,281
3.3
3.4
74.0
90.0
19.2
15.8
3.7
3.1
17.0
17.2
-
-
FMCG
Akzo Nobel India
Neutral
1,775
-
8,511
2,955
3,309
13.3
13.7
57.2
69.3
31.1
25.6
10.1
8.5
32.7
33.3
2.7
2.4
Asian Paints
Neutral
1,093
-
104,840
17,128
18,978
16.8
16.4
19.1
20.7
57.2
52.8
19.9
18.8
34.8
35.5
6.0
5.5
Britannia
Neutral
3,533
-
42,399
9,594
11,011
14.6
14.9
80.3
94.0
44.0
37.6
18.1
14.0
41.2
-
4.3
3.7
Colgate
Neutral
990
-
26,914
4,605
5,149
23.4
23.4
23.8
26.9
41.6
36.8
23.0
18.0
64.8
66.8
5.8
5.1
Dabur India
Accumulate
269
304
47,420
8,315
9,405
19.8
20.7
8.1
9.2
33.2
29.3
9.3
7.7
31.6
31.0
5.4
4.7
GlaxoSmith Con*
Neutral
5,277
-
22,191
4,350
4,823
21.2
21.4
179.2
196.5
29.5
26.9
7.8
6.6
27.1
26.8
4.5
4.0
Stock Watch
May 25, 2017
Company Name
Reco
CMP
Target
Mkt Cap
Sales ( Čcr )
OPM(%)
EPS (Č)
PER(x)
P/BV(x)
RoE(%)
EV/Sales(x)
(Č)
Price ( Č)
( Č cr )
FY17E FY18E
FY17E
FY18E
FY17E
FY18E
FY17E
FY18E
FY17E
FY18E
FY17E
FY18E
FY17E
FY18E
FMCG
Godrej Consumer
Neutral
1,759
-
59,922
10,235
11,428
18.4
18.6
41.1
44.2
42.8
39.8
9.5
8.0
24.9
24.8
5.9
5.3
HUL
Neutral
1,038
-
224,670
35,252
38,495
17.8
17.8
20.7
22.4
50.3
46.4
48.0
41.2
95.6
88.9
6.2
5.7
ITC
Neutral
300
-
364,361
40,059
44,439
38.3
39.2
9.0
10.1
33.4
29.6
9.3
8.1
27.8
27.5
8.6
7.7
Marico
Neutral
311
-
40,147
6,430
7,349
18.8
19.5
6.4
7.7
48.6
40.4
14.7
12.4
33.2
32.5
6.1
5.2
Nestle*
Neutral
6,526
-
62,925
10,073
11,807
20.7
21.5
124.8
154.2
52.3
42.3
21.5
19.3
34.8
36.7
6.1
5.1
Procter & Gamble
Neutral
7,351
-
23,862
2,939
3,342
23.2
23.0
146.2
163.7
50.3
44.9
12.7
10.6
25.3
23.5
7.7
6.7
Hygiene
Tata Global
Neutral
142
-
8,943
8,675
9,088
9.8
9.8
7.4
8.2
19.2
17.3
1.5
1.4
7.9
8.1
1.0
0.9
IT
HCL Tech^
Buy
855
1,014
122,007
46,723
52,342
22.1
20.9
60.0
62.8
14.3
13.6
3.6
3.1
25.3
22.4
2.3
2.0
Infosys
Buy
954
1,179
219,025
68,484
73,963
26.0
26.0
63.0
64.0
15.1
14.9
3.2
2.9
20.8
19.7
2.9
2.5
TCS
Neutral
2,558
-
503,996
117,966
127,403
27.5
27.6
134.3
144.5
19.1
17.7
5.7
5.3
29.8
29.7
3.9
3.7
Tech Mahindra
Buy
417
600
40,638
29,673
32,937
15.5
17.0
32.8
39.9
12.7
10.5
2.5
2.2
19.6
20.7
1.1
0.9
Wipro
Accumulate
525
570
127,699
55,421
58,536
20.3
20.3
35.1
36.5
15.0
14.4
2.6
2.2
19.2
14.6
1.7
1.5
Media
D B Corp
Neutral
354
-
6,501
2,297
2,590
27.4
28.2
21.0
23.4
16.8
15.1
3.9
3.4
23.7
23.1
2.6
2.3
Hindustan Media
Neutral
277
-
2,036
1,016
1,138
24.3
25.2
27.3
30.1
10.2
9.2
1.9
1.7
16.2
15.8
1.3
1.2
Ventures
HT Media
Neutral
80
-
1,863
2,693
2,991
12.6
12.9
7.9
9.0
10.1
8.9
0.9
0.8
7.8
8.3
0.3
0.2
Jagran Prakashan
Buy
177
225
5,783
2,355
2,635
28.0
28.0
10.8
12.5
16.4
14.2
3.6
3.1
21.7
21.7
2.5
2.2
Sun TV Network
Neutral
782
-
30,819
2,850
3,265
70.1
71.0
26.2
30.4
29.9
25.7
7.6
6.7
24.3
25.6
10.4
9.0
TV Today Network
Buy
253
344
1,506
567
645
26.7
27.0
15.4
18.1
16.4
14.0
2.5
2.1
14.9
15.2
2.2
1.9
Metals & Mining
Coal India
Neutral
262
-
162,696
84,638
94,297
21.4
22.3
24.5
27.1
10.7
9.7
4.5
4.2
42.6
46.0
1.4
1.3
Hind. Zinc
Neutral
232
-
98,027
14,252
18,465
55.9
48.3
15.8
21.5
14.7
10.8
2.4
2.1
17.0
20.7
6.9
5.3
Hindalco
Neutral
187
-
41,917
107,899
112,095
7.4
8.2
9.2
13.0
20.3
14.4
1.0
0.9
4.8
6.6
0.9
0.8
JSW Steel
Neutral
189
-
45,770
53,201
58,779
16.1
16.2
130.6
153.7
1.5
1.2
0.2
0.2
14.0
14.4
1.6
1.4
NMDC
Neutral
116
-
36,575
6,643
7,284
44.4
47.7
7.1
7.7
16.3
15.0
1.4
1.4
8.8
9.2
3.3
2.9
SAIL
Neutral
57
-
23,562
47,528
53,738
(0.7)
2.1
(1.9)
2.6
21.9
0.6
0.6
(1.6)
3.9
1.3
1.2
Tata Steel
Neutral
483
-
46,905
121,374
121,856
7.2
8.4
18.6
34.3
26.0
14.1
1.6
1.5
6.1
10.1
1.0
1.0
Vedanta
Neutral
224
-
83,228
71,744
81,944
19.2
21.7
13.4
20.1
16.7
11.1
1.4
1.3
8.4
11.3
1.6
1.2
Oil & Gas
GAIL
Neutral
390
-
65,995
56,220
65,198
9.3
10.1
27.1
33.3
14.4
11.7
1.3
1.2
9.3
10.7
1.4
1.2
Indian Oil Corp
Neutral
431
-
209,071
373,359
428,656
5.9
5.5
54.0
59.3
8.0
7.3
1.2
1.1
16.0
15.6
0.7
0.6
ONGC
Neutral
174
-
222,657
137,222
152,563
15.0
21.8
19.5
24.1
8.9
7.2
0.8
0.7
8.5
10.1
1.9
1.7
Stock Watch
May 25, 2017
Company Name
Reco
CMP
Target
Mkt Cap
Sales ( Čcr )
OPM(%)
EPS (Č)
PER(x)
P/BV(x)
RoE(%)
EV/Sales(x)
(Č)
Price ( Č)
( Č cr )
FY17E FY18E
FY17E
FY18E
FY17E
FY18E
FY17E
FY18E
FY17E
FY18E
FY17E
FY18E
FY17E
FY18E
Oil & Gas
Reliance Industries
Neutral
1,297
-
421,711
301,963
358,039
12.1
12.6
87.7
101.7
14.8
12.8
1.5
1.4
10.7
11.3
1.9
1.6
Pharmaceuticals
Alembic Pharma
Accumulate
580
648
10,938
3,101
3,966
19.7
20.5
21.4
25.5
27.1
22.8
5.8
4.7
23.0
22.8
3.5
2.6
Alkem Laboratories Ltd
Buy
1,829
2,257
21,870
6,065
7,009
18.7
20.0
80.2
92.0
22.8
19.9
5.1
4.3
22.5
21.6
3.6
3.1
Aurobindo Pharma
Buy
525
877
30,782
15,720
18,078
23.7
23.7
41.4
47.3
12.7
11.1
3.3
2.6
29.6
26.1
2.2
1.9
Aventis*
Neutral
4,030
-
9,281
2,206
2,508
16.6
16.8
128.9
139.9
31.3
28.8
5.3
4.2
21.6
23.5
4.0
3.3
Cadila Healthcare
Neutral
441
-
45,137
10,429
12,318
17.7
21.6
13.1
19.2
33.7
23.0
7.0
5.6
22.8
27.1
4.4
3.6
Cipla
Reduce
520
465
41,865
15,378
18,089
15.7
16.8
19.3
24.5
27.0
21.2
3.2
2.8
12.3
13.9
2.9
2.4
Dishman Pharma
Sell
269
143
4,343
1,718
1,890
22.7
22.8
9.5
11.3
28.3
23.8
2.7
2.5
10.1
10.9
3.0
2.6
Dr Reddy's
Neutral
2,521
-
41,759
14,081
15,937
16.1
18.6
72.6
105.9
34.7
23.8
3.4
3.1
9.6
13.6
3.2
2.8
GSK Pharma*
Neutral
2,400
-
20,325
2,927
3,290
11.8
16.2
34.4
49.6
69.8
48.4
10.1
10.5
13.9
21.3
6.7
6.1
Indoco Remedies
Buy
194
240
1,789
1,112
1,289
16.2
18.2
11.6
16.0
16.7
12.1
2.7
2.3
17.0
20.1
1.7
1.4
Ipca labs
Buy
491
613
6,195
3,258
3,747
12.8
15.3
12.1
19.2
40.6
25.6
2.5
2.3
6.4
9.5
2.0
1.8
Lupin
Buy
1,228
1,809
55,449
15,912
18,644
26.4
26.7
58.1
69.3
21.1
17.7
4.1
3.4
21.4
20.9
3.6
2.9
Natco Pharma
Accumulate
889
974
15,492
2,090
2,335
32.1
26.6
26.8
23.2
33.1
38.3
9.4
8.1
28.4
21.1
7.5
91.8
Sun Pharma
Buy
603
847
144,686
31,129
35,258
32.0
32.9
30.2
35.3
20.0
17.1
3.3
2.7
20.0
20.1
4.2
3.5
Power
NTPC
Neutral
156
-
128,753
86,605
95,545
17.5
20.8
11.8
13.4
13.2
11.7
1.3
1.3
10.5
11.1
2.8
2.8
Power Grid
Accumulate
200
223
104,553
25,315
29,193
88.2
88.7
14.2
17.2
14.1
11.6
2.1
1.9
15.2
16.1
8.8
7.9
Tata Power
Neutral
80
-
21,706
36,916
39,557
17.4
27.1
5.1
6.3
15.7
12.7
1.4
1.3
9.0
10.3
1.6
1.4
Real Estate
MLIFE
Buy
416
522
2,133
1,152
1,300
22.7
24.6
29.9
35.8
13.9
11.6
1.0
1.0
7.6
8.6
2.6
2.2
Prestige Estate
Neutral
230
-
8,640
4,707
5,105
25.2
26.0
10.3
13.0
22.4
17.7
1.8
1.7
10.3
10.2
3.0
2.7
Telecom
Bharti Airtel
Neutral
369
-
147,304
105,086
114,808
34.5
34.7
12.2
16.4
30.2
22.5
2.0
1.9
6.8
8.4
2.3
2.0
Idea Cellular
Neutral
79
-
28,414
40,133
43,731
37.2
37.1
6.4
6.5
12.3
12.1
1.0
1.0
8.2
7.6
1.7
1.5
zOthers
Abbott India
Neutral
4,098
-
8,708
3,153
3,583
14.1
14.4
152.2
182.7
26.9
22.4
132.2
112.9
25.6
26.1
2.5
2.1
Asian Granito
Buy
339
405
1,020
1,060
1,169
12.2
12.5
12.7
15.9
26.8
21.3
2.5
2.3
9.5
10.7
1.3
1.1
Bajaj Electricals
Buy
327
395
3,313
4,801
5,351
5.7
6.2
10.4
13.7
31.4
23.9
3.9
3.5
12.4
14.5
0.7
0.6
Banco Products (India)
Neutral
209
-
1,496
1,353
1,471
12.3
12.4
14.5
16.3
14.4
12.8
19.9
18.0
14.5
14.6
1.0
112.2
Coffee Day Enterprises
Neutral
250
-
5,141
2,964
3,260
20.5
21.2
4.7
8.0
-
31.2
2.9
2.6
5.5
8.5
2.1
1.9
Ltd
Competent Automobiles Neutral
194
-
125
1,137
1,256
3.1
2.7
28.0
23.6
6.9
8.2
37.4
33.8
14.3
11.5
0.1
0.1
Elecon Engineering
Neutral
58
-
647
1,482
1,660
13.7
14.5
3.9
5.8
14.8
9.9
3.5
3.2
7.8
10.9
0.8
0.7
Stock Watch
May 25, 2017
Company Name
Reco
CMP
Target
Mkt Cap
Sales ( Čcr )
OPM(%)
EPS (Č)
PER(x)
P/BV(x)
RoE(%)
EV/Sales(x)
(Č)
Price ( Č)
( Č cr )
FY17E
FY18E
FY17E
FY18E
FY17E
FY18E
FY17E
FY18E
FY17E
FY18E
FY17E
FY18E
FY17E
FY18E
zOthers
Finolex Cables
Neutral
489
-
7,477
2,883
3,115
12.0
12.1
14.2
18.6
34.4
26.3
18.3
16.0
15.8
14.6
2.3
2.1
Garware Wall Ropes
Neutral
764
-
1,671
863
928
15.1
15.2
36.4
39.4
21.0
19.4
3.8
3.2
17.5
15.9
1.8
1.7
Goodyear India*
Neutral
812
-
1,873
1,598
1,704
10.4
10.2
49.4
52.6
16.4
15.4
75.9
66.6
18.2
17.0
0.9
121.1
Hitachi
Neutral
1,815
-
4,934
2,081
2,433
8.8
8.9
33.4
39.9
54.3
45.5
43.8
36.5
22.1
21.4
2.4
2.0
HSIL
Neutral
338
-
2,444
2,384
2,515
15.8
16.3
15.3
19.4
22.1
17.4
22.0
18.9
7.8
9.3
1.2
1.1
Interglobe Aviation
Neutral
1,058
-
38,233
21,122
26,005
14.5
27.6
110.7
132.1
9.6
8.0
57.2
40.8
168.5
201.1
1.8
1.4
Jyothy Laboratories
Neutral
373
-
6,774
1,440
2,052
11.5
13.0
8.5
10.0
43.9
37.3
10.6
9.8
18.6
19.3
5.0
3.5
Kirloskar Engines India
Neutral
380
-
5,495
2,554
2,800
9.9
10.0
10.5
12.1
36.2
31.4
15.1
14.3
10.7
11.7
1.8
1.6
Ltd
Linc Pen & Plastics
Neutral
252
-
372
382
420
9.3
9.5
13.5
15.7
18.7
16.0
3.2
2.8
17.1
17.3
1.0
0.9
M M Forgings
Neutral
591
-
713
546
608
20.4
20.7
41.3
48.7
14.3
12.1
81.0
71.7
16.6
17.0
1.2
1.0
Manpasand Bever.
Neutral
732
-
4,188
836
1,087
19.6
19.4
16.9
23.8
43.3
30.7
5.2
4.5
12.0
14.8
4.8
3.6
Mirza International
Neutral
140
-
1,690
963
1,069
17.2
18.0
6.1
7.5
22.9
18.7
3.5
3.0
15.0
15.7
2.0
1.8
MT Educare
Neutral
65
-
257
366
417
17.7
18.2
9.4
10.8
6.9
6.0
1.5
1.3
22.2
22.3
0.6
0.5
Narayana Hrudaya
Neutral
296
-
6,039
1,873
2,166
11.5
11.7
2.6
4.0
111.7
74.5
6.9
6.2
6.1
8.3
3.3
2.9
Navkar Corporation
Buy
204
265
2,909
369
561
42.9
42.3
6.9
11.5
29.5
17.7
2.1
1.9
7.4
10.5
8.9
5.8
Navneet Education
Neutral
159
-
3,718
1,062
1,147
24.0
24.0
6.1
6.6
26.1
24.0
5.4
4.8
20.6
19.8
3.6
3.3
Nilkamal
Neutral
1,892
-
2,823
1,995
2,165
10.7
10.4
69.8
80.6
27.1
23.5
108.1
93.9
16.6
16.5
1.4
1.3
Page Industries
Neutral
14,064
-
15,687
2,450
3,124
20.1
17.6
299.0
310.0
47.0
45.4
313.2
239.1
47.1
87.5
6.5
5.1
Parag Milk Foods
Neutral
235
-
1,980
1,919
2,231
9.3
9.6
9.5
12.9
24.9
18.2
3.9
3.2
15.5
17.5
1.2
1.0
Quick Heal
Neutral
205
-
1,434
408
495
27.3
27.0
7.7
8.8
26.4
23.3
2.5
2.5
9.3
10.6
2.7
2.2
Radico Khaitan
Buy
121
147
1,604
1,667
1,824
13.0
13.2
6.7
8.2
18.1
14.7
1.6
1.5
9.0
10.2
1.4
1.2
Relaxo Footwears
Neutral
474
-
5,694
2,085
2,469
9.2
8.2
7.6
8.0
62.7
59.6
24.3
20.8
17.9
18.8
2.8
2.4
S H Kelkar & Co.
Neutral
275
-
3,980
1,036
1,160
15.1
15.0
6.1
7.2
45.1
38.3
4.8
4.4
10.7
11.5
3.7
3.3
Siyaram Silk Mills
Accumulate
1,775
1,872
1,664
1,652
1,857
11.6
11.7
92.4
110.1
19.2
16.1
2.8
2.5
14.7
15.2
1.2
1.1
Styrolution ABS India*
Neutral
717
-
1,261
1,440
1,537
9.2
9.0
40.6
42.6
17.7
16.8
45.1
41.0
12.3
11.6
0.8
0.7
Surya Roshni
Neutral
263
-
1,151
3,342
3,625
7.8
7.5
17.3
19.8
15.2
13.3
28.9
23.2
10.5
10.8
0.6
0.5
Team Lease Serv.
Neutral
1,138
-
1,946
3,229
4,001
1.5
1.8
22.8
32.8
50.0
34.7
5.4
4.6
10.7
13.4
0.5
0.4
The Byke Hospitality
Neutral
190
-
763
287
384
20.5
20.5
7.6
10.7
25.1
17.8
5.2
4.2
20.7
23.5
2.7
2.0
Transport Corporation of
Neutral
250
-
1,915
2,671
2,911
8.5
8.8
13.9
15.7
18.1
16.0
2.5
2.2
13.7
13.8
0.8
0.8
India
Stock Watch
May 25, 2017
Company Name
Reco
CMP
Target Mkt Cap
Sales ( Čcr )
OPM(%)
EPS (Č)
PER(x)
P/BV(x)
RoE(%)
EV/Sales(x)
(Č)
Price ( Č)
( Č cr )
FY17E FY18E FY17E FY18E FY17E FY18E FY17E FY18E FY17E FY18E FY17E FY18E FY17E FY18E
zOthers
TVS Srichakra
Neutral
3,844
-
2,943
2,304
2,614
13.7
13.8
231.1
266.6
16.6
14.4
431.9
340.1
33.9
29.3
1.3
1.1
UFO Moviez
Neutral
374
-
1,033
619
685
33.2
33.4
30.0
34.9
12.5
10.7
1.7
1.5
13.8
13.9
1.4
1.1
Visaka Industries
Neutral
354
-
561
1,051
1,138
10.3
10.4
21.0
23.1
16.8
15.3
45.3
42.4
9.0
9.2
0.8
0.8
VRL Logistics
Neutral
308
-
2,811
1,902
2,119
16.7
16.6
14.6
16.8
21.2
18.3
4.6
4.1
21.9
22.2
1.6
1.4
Wonderla Holidays
Neutral
371
-
2,094
287
355
38.0
40.0
11.3
14.2
32.8
26.1
4.7
4.1
21.4
23.9
7.0
5.7
VIP Industries
Buy
183
218
2,592
1,270
1,450
10.4
10.4
5.6
6.5
32.8
28.2
6.8
5.9
20.7
21.1
2.0
1.8
Navin Fluorine
Buy
2,900
3,650
2,839
789
945
21.1
22.4
120.1
143.4
24.2
20.2
3.9
3.3
17.8
18.5
3.5
2.9
Source: Company, Angel Research; Note: *December year end; #September year end; &October year end; Price as on May 24, 2017
Market Outlook
May 25, 2017
Research Team Tel: 022 - 39357800
DISCLAIMER
Angel Broking Private Limited (hereinafter referred to as “Angel”) is a registered Member of National Stock Exchange of India
Limited,Bombay Stock Exchange Limited and Metropolitan Stock Exchange Limited. It is also registered as a Depository Participant with
CDSL and Portfolio Manager with SEBI. It also has registration with AMFI as a Mutual Fund Distributor. Angel Broking Private Limited is a
registered entity with SEBI for Research Analyst in terms of SEBI (Research Analyst) Regulations, 2014 vide registration number
INH000000164. Angel or its associates has not been debarred/ suspended by SEBI or any other regulatory authority for accessing
/dealing in securities Market. Angel or its associates/analyst has not received any compensation / managed or
co-managed public offering of securities of the company covered by Analyst during the past twelve months.
This document is solely for the personal information of the recipient, and must not be singularly used as the basis of any investment
decision. Nothing in this document should be construed as investment or financial advice. Each recipient of this document should make
such investigations as they deem necessary to arrive at an independent evaluation of an investment in the securities of the companies
referred to in this document (including the merits and risks involved), and should consult their own advisors to determine the merits and
risks of such an investment.
Reports based on technical and derivative analysis center on studying charts of a stock's price movement, outstanding positions and
trading volume, as opposed to focusing on a company's fundamentals and, as such, may not match with a report on a company's
fundamentals. Investors are advised to refer the Fundamental and Technical Research Reports available on our website to evaluate the
contrary view, if any.
The information in this document has been printed on the basis of publicly available information, internal data and other reliable
sources believed to be true, but we do not represent that it is accurate or complete and it should not be relied on as such, as this
document is for general guidance only. Angel Broking Pvt. Limited or any of its affiliates/ group companies shall not be in any way
responsible for any loss or damage that may arise to any person from any inadvertent error in the information contained in this report.
Angel Broking Pvt. Limited has not independently verified all the information contained within this document. Accordingly, we cannot
testify, nor make any representation or warranty, express or implied, to the accuracy, contents or data contained within this document.
While Angel Broking Pvt. Limited endeavors to update on a reasonable basis the information discussed in this material, there may be
regulatory, compliance, or other reasons that prevent us from doing so.
This document is being supplied to you solely for your information, and its contents, information or data may not be reproduced,
redistributed or passed on, directly or indirectly.
Neither Angel Broking Pvt. Limited, nor its directors, employees or affiliates shall be liable for any loss or damage that may arise from
or in connection with the use of this information.